

Obsidian Metadata
Traces
A trace is the complete record of all actions, messages, tool calls, and data retrievals from a single initial user query through to the final response. It covers every step across all agents, tools, and system components in a session: multiple user messages, assistant responses, retrieved documents, and intermediate tool interactions.
Anthropic uses transcript, trace, and trajectory interchangeably: “the complete record of a trial, including outputs, tool calls, reasoning, intermediate results”. For the Anthropic API, that’s the full messages array at the end of a run. They separate it from the outcome, which is the final state of the environment. An agent that says “your flight is booked” has a transcript; whether a reservation row exists in the database is the outcome.
In classic software, a trace is “a logical grouping of logs”, such as a request flowing through a distributed system. For LLM products it’s usually a conversation plus everything the system did behind it.
Logging traces is a prerequisite
You can’t do Error Analysis, human evaluation, or LLM-as-Judge without traces. Instrument early. Tools include LangSmith, Arize Phoenix, Braintrust, Langfuse, OpenLLMetry, HoneyHive, and others (see Eval Tooling and Vendors). Whatever you choose, searching, filtering and reading traces are the essential features, and some tools implement them poorly.
What to log (checklist)
- Every user message and assistant response, with turn order.
- System prompt / prompt version, model name and version.
- Every tool call: name, arguments, result, errors, plus the resulting state change.
- Retrieved documents / chunks, with IDs.
- Intermediate reasoning / planning steps.
- Session / trace ID on every event, plus a source (which agent or tool) and position in the sequence. This is essential for multi-agent flows (see Multi-turn Conversation Evaluation).
- Human handoffs: the decision, reason, context transferred, wait time, human actions, and final resolution. The trace ends when the user’s need is resolved, not at the handoff (see Human Handoff Evaluation).
- Business outcome: DB writes, emails sent, calendar invites, approvals (see Multi-Step Workflow Evaluation).
- Metadata for filtering: channel (SMS/voice/chat), user type, pipeline version, synthetic vs real, feature/scenario.
- Latency, token counts, cost.
Sensitive data
If sensitive information can’t be stored, redact it before logging, and check the redaction tool’s output because redactors miss things. See Evals with Sensitive Data.
Vendor terminology differs
Vendors don’t agree on names for traces and spans. Alex Strick van Linschoten’s June 2025 survey:
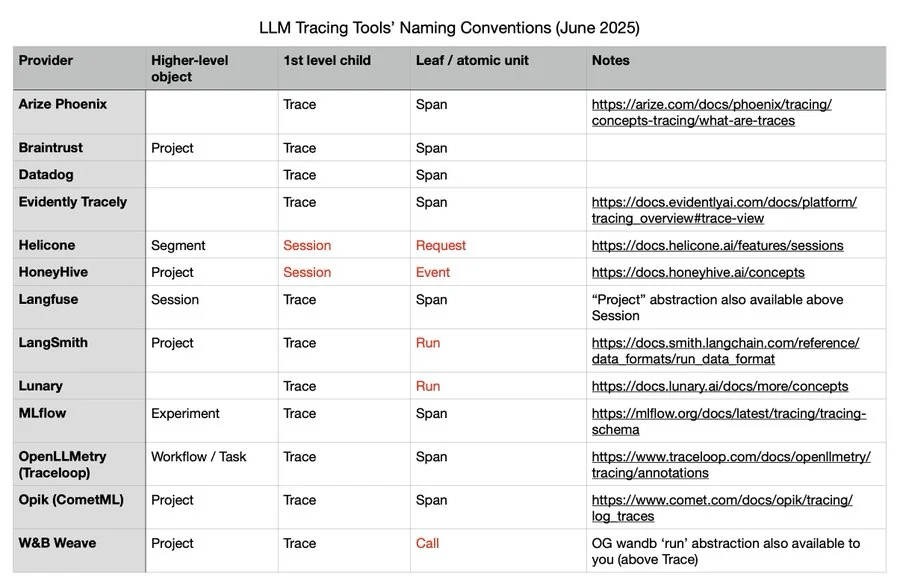
| Provider | Higher-level | 1st-level child | Leaf / atomic |
|---|---|---|---|
| Arize Phoenix | – | Trace | Span |
| Braintrust | Project | Trace | Span |
| Datadog | – | Trace | Span |
| Helicone | Segment | Session | Request |
| HoneyHive | Project | Session | Event |
| Langfuse | Session | Trace | Span |
| LangSmith | Project | Trace | Run |
| Lunary | – | Trace | Run |
| MLflow | Experiment | Trace | Span |
| OpenLLMetry | Workflow/Task | Trace | Span |
| Opik | Project | Trace | Span |
| W&B Weave | Project | Trace | Call |
How to read a trace
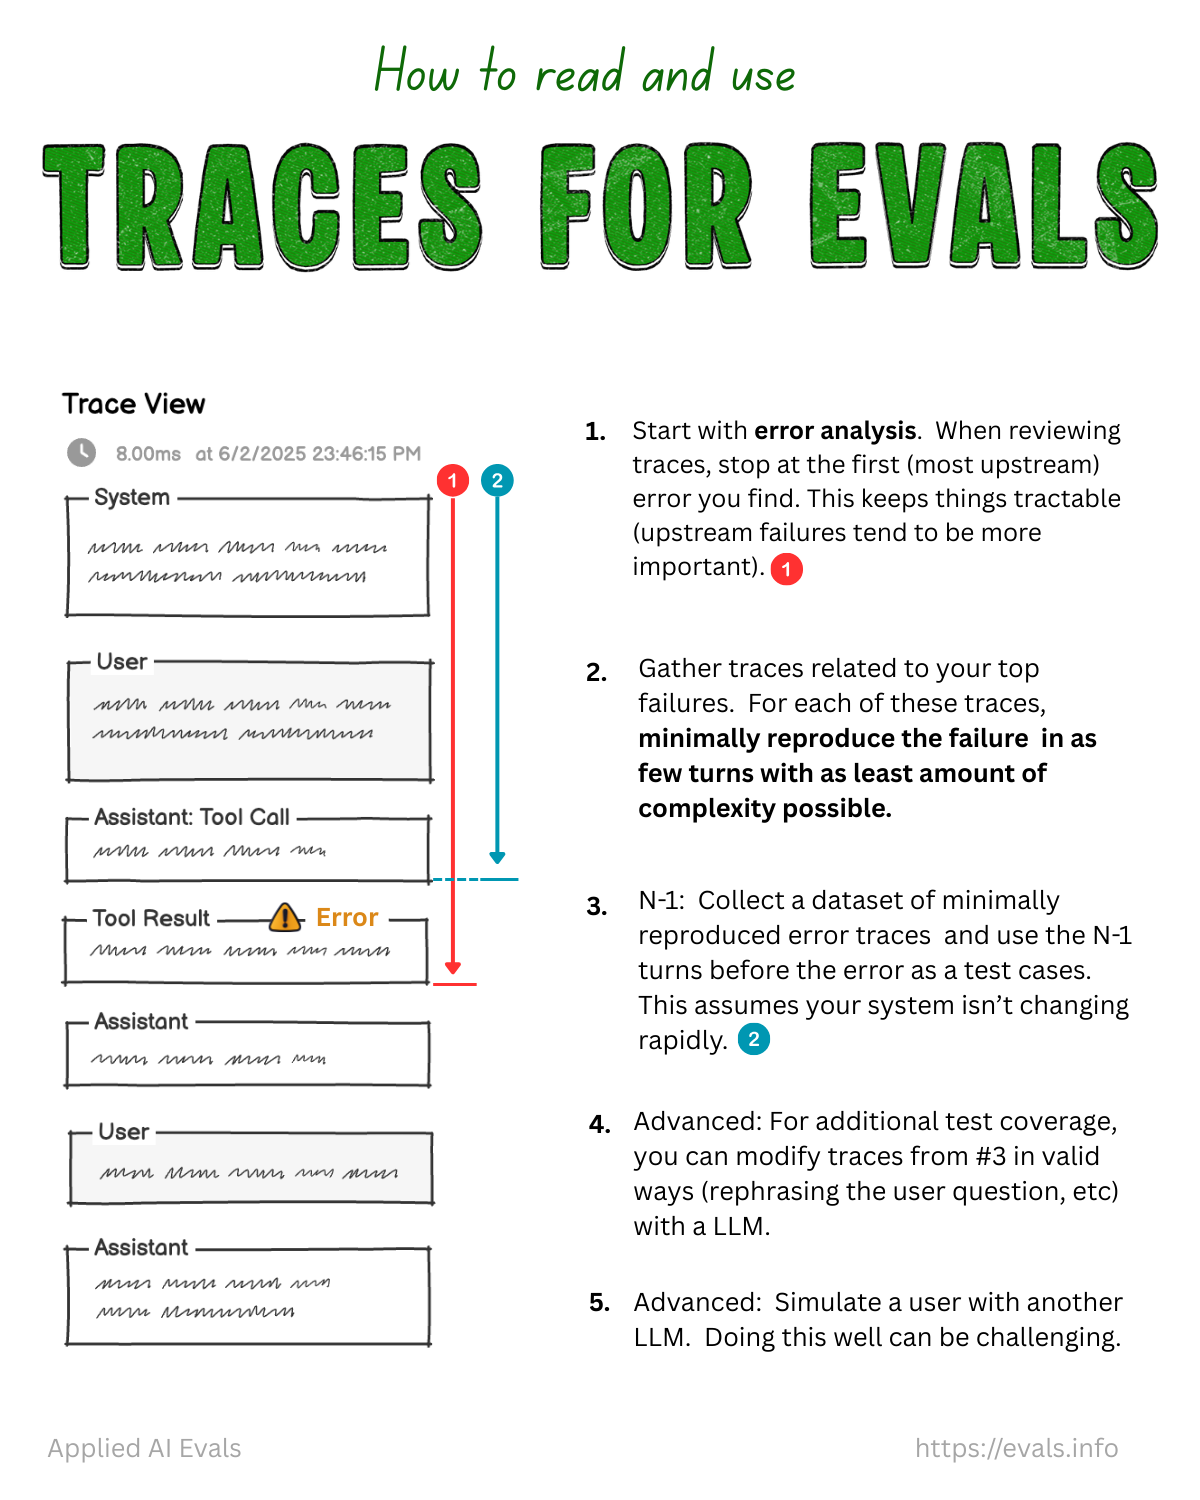
- During error analysis, stop at the first (most upstream) error. Upstream failures tend to matter more and cause downstream ones.
- Gather traces for your top failures and reproduce each failure minimally: as few turns and as little complexity as possible.
- N-1 testing: use the N-1 turns before the error as a test case (this assumes the system isn’t changing fast).
- Advanced: modify those traces in valid ways (for example, rephrase the user question) with an LLM for more coverage.
- Advanced: simulate the user with another LLM. This is hard to do well.
For very long traces, see Reviewing Large Traces.
Related
Error Analysis · Trace Sampling Strategies · Annotation Tools and Review Interfaces · Agentic Workflow Evaluation