

Obsidian Metadata
| type | concept |
| sources | Source - AI Evals FAQ, Source - Evals Skills for Coding Agents |
Trace Sampling Strategies
How to pick which traces to review, beyond “whatever users complained about”.
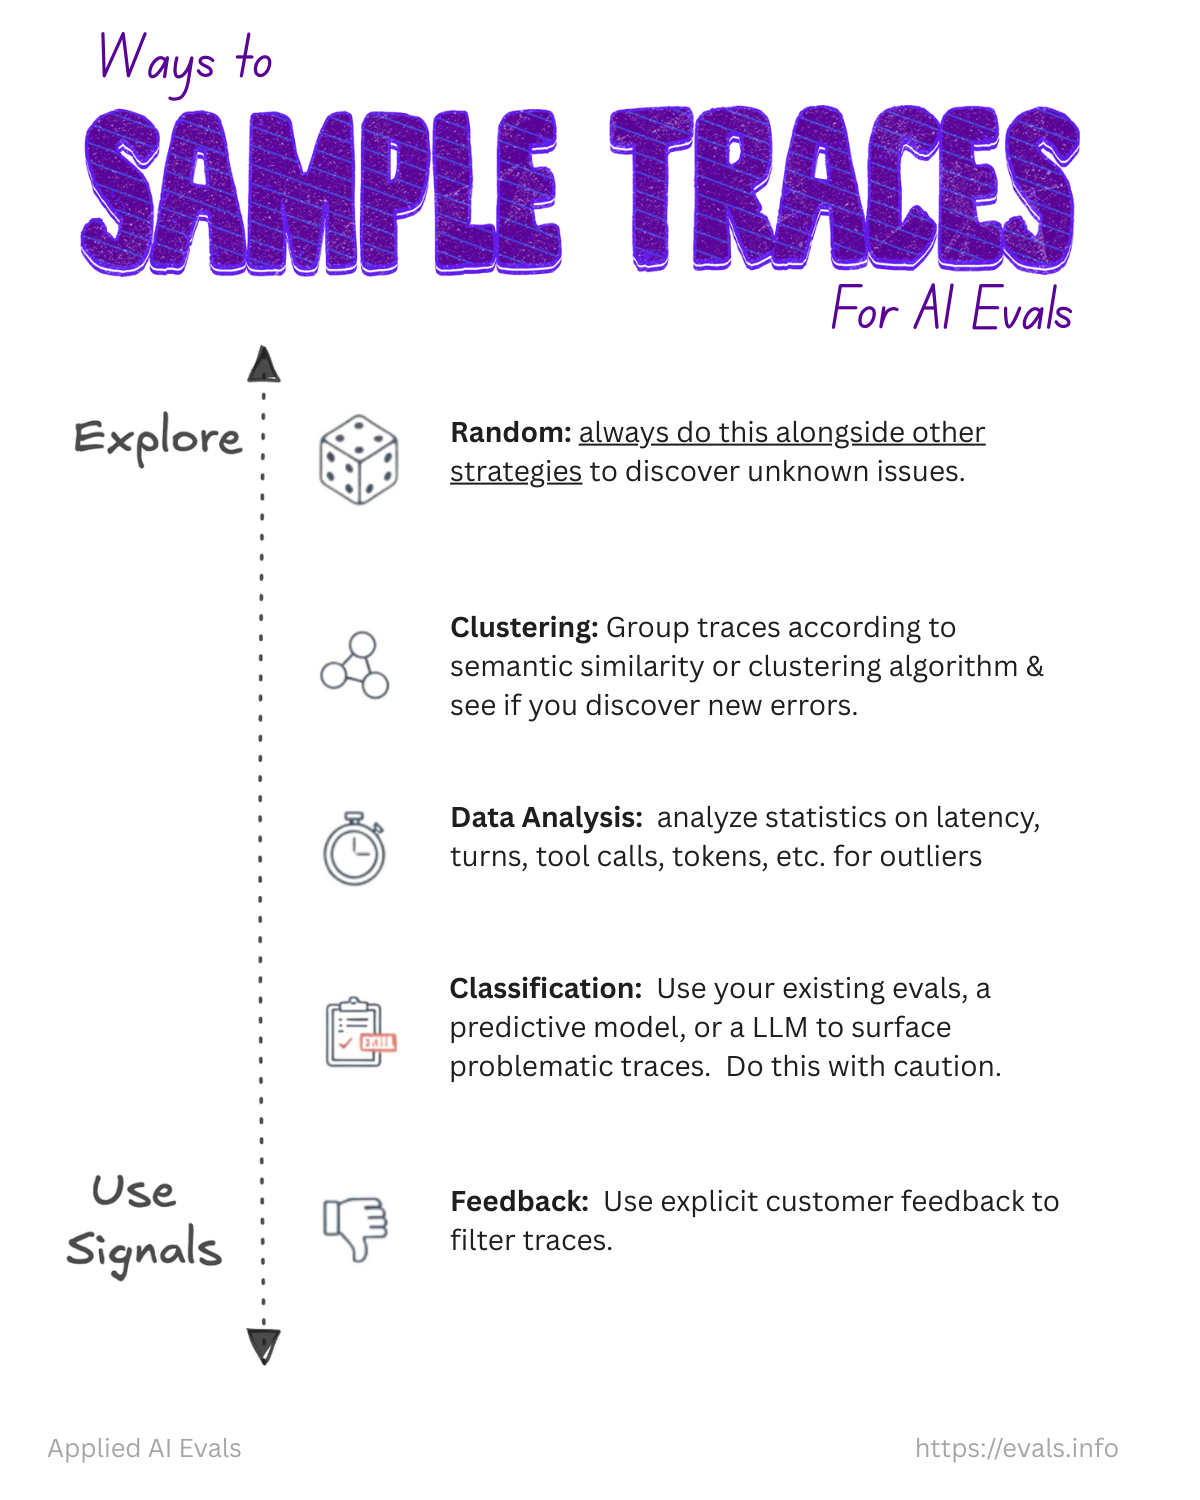
| Method | What it does | Main limitation |
|---|---|---|
| Random | Every trace equally likely | A small batch can miss rare cases |
| Clustering | Group by similar content (embeddings or features), sample from each group | Depends on feature and clustering choices |
| Data analysis | Review extremes: latency, tool count, turns, tokens, retries, length | An extreme value may have nothing to do with quality |
| Classification | An evaluator or model flags likely failures | Favors problems the classifier already knows |
| Feedback | Negative user feedback, complaints, thumbs-down | Misses problems users don’t report |
The table runs from most exploratory to most targeted. When starting out, optimize for exploration. As you learn, lean more on signals. The right mix takes experimentation.
Always keep some random traces in every batch
They’re how you find failure modes your current signals don’t describe.
Escalation path
- Start with random sampling.
- If you find few issues, stress test: write queries that deliberately probe your prompt’s constraints to see whether the AI follows the rules.
- Use existing evals as a screen to surface candidates, then do Error Analysis on them.
- Use outlier detection, metric-based sorting, stratified sampling, and Generic Metrics as exploration signals.
Rare failure modes
Use targeted sampling. Search for signals correlated with the failure: a specific tool sequence, unusually long traces, retries, a known input pattern. Review the batch to collect examples and sharpen the failure definition.
Stratified sampling of real data
- Identify high-variance dimensions (length, topic, complexity, constraints).
- Label groups manually for small sets, or with K-means on query embeddings for large ones.
- Sample from each group so you cover more than the most common query types.
Active learning with an agent
A system asks the human to label the most informative points next. In Shreya Shankar’s walkthrough, Claude Code clusters traces and picks examples from each cluster. A monitor command watches annotations.json, and when a label arrives the agent updates the failure taxonomy and looks for similar cases (depth) or different failures (breadth). This works anywhere you annotate, not just in error analysis (see Error Discovery Skill Workflow).
Initial sample recipe (error-discovery skill), for datasets over 50: 15–25 items, with 60–70% cluster representatives (1–2 closest to each of 6–10 KMeans centroids) and 30–40% random. Prioritize diversity, because the goal is discovery, not prevalence.
Between review cycles
Review 10–20 traces weekly, focusing on outliers: unusually long conversations, sessions with many retries, traces flagged by monitoring (see Eval Maintenance and Cadence).
Related
Error Analysis · Traces · Annotation Tools and Review Interfaces