

Obsidian Metadata
Error Analysis
The single most important activity in evals
Error analysis decides which evals to write in the first place. Every other practice in this vault (judges, synthetic data, CI sets, dashboards) sits downstream of it. Hamel calls it “consistently the highest-ROI activity” in AI development.
Error analysis means reading traces from your application in a structured way, writing down what goes wrong, and grouping those notes into a failure taxonomy of failure modes specific to your product. The method comes from qualitative research (grounded theory). The evals-skills plugin calls the same step error discovery.
Why it matters
- It keeps eval metrics tied to real application behavior instead of generic metrics (helpfulness, coherence), which most platforms push you toward.
- It finds failures you could not have predicted. LLMs have an “infinite surface area” for failure (see Eval-Driven Development).
- Many findings are plain bugs you fix right away and never need an evaluator (see When to Build an Automated Evaluator).
- It gives the domain expert a place to state what they want. You can’t fully define your criteria before you see outputs (Criteria Drift).
- It builds a “nose” for where failures hide in your data. That skill only comes with practice.
The process
1. Create a dataset
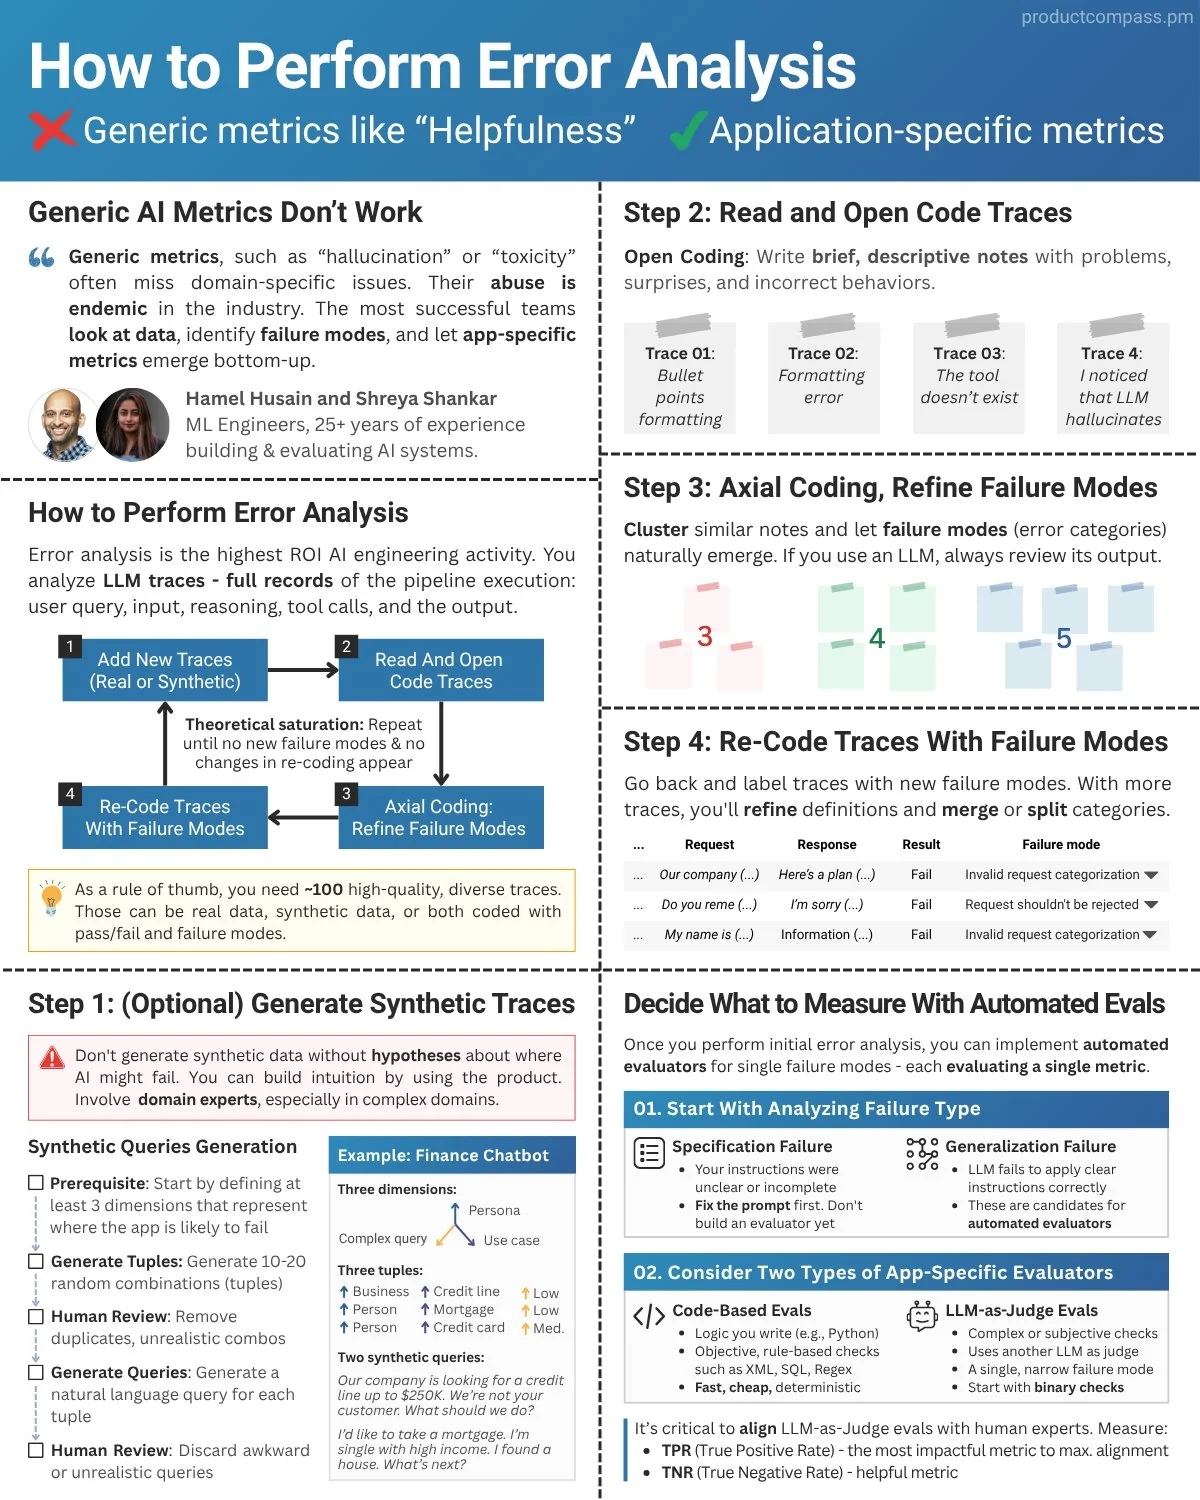
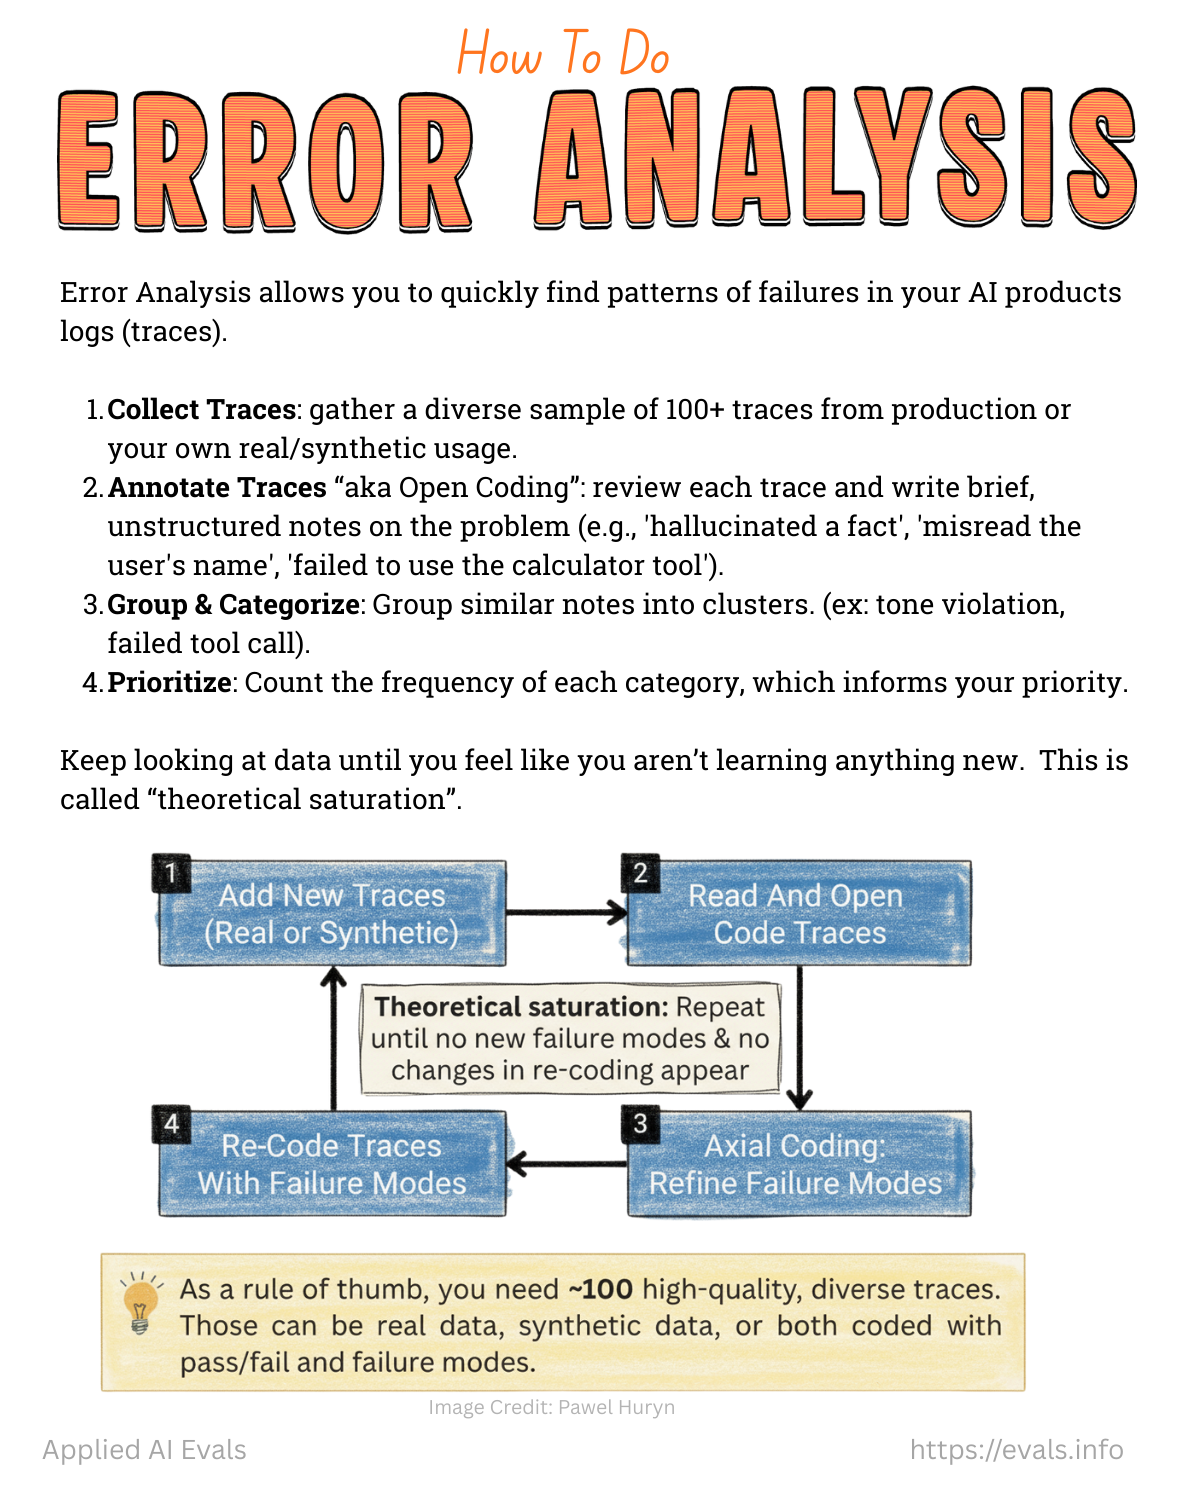
Collect representative traces (Traces) of real user interactions. With no traffic yet, generate synthetic inputs and run them through the full system. A working pool of ~100 diverse traces is a good starting point.
2. Open coding (journaling)
A human annotator reviews traces and writes free-text notes about anything that looks wrong from the user’s point of view. Ideally this is the benevolent dictator or domain expert.
- Annotate at least 30 traces yourself before you look at any agent or LLM suggestions. Early suggestions bias your judgment.
- Focus on the first (most upstream) failure in each trace. Upstream errors cascade downstream (see Multi-turn Conversation Evaluation). Once you have experience, you can also tag independent failures.
- Record problems that aren’t the model’s fault, such as missing features, a missing tracking link, or broken UX. Record everything that makes the product less useful.
- Defer root-cause analysis. Note what went wrong, not why. You’ll write better annotations and get through more data.
- Don’t start from a rubric. A rubric makes reviewers miss things outside it (see Criteria Drift).
3. Axial coding (build the failure taxonomy)
Group the open-ended notes into distinct failure categories, then count how many fall in each category. This is the most important step.
- An LLM can propose the first groupings. You must review and refine them. An LLM may merge “app crashes after login” (stability) with “login takes too long” (performance) into one “login issues” category, even though the two need different fixes.
- The output is a table like: failure mode → description → count → example trace IDs.
- A spreadsheet pivot table is enough (see Nurture Boss, where three issues made up more than 60% of all problems).
4. Iterative refinement until saturation
- Have an agent cluster the pool and pick a diverse initial sample (cluster representatives plus random picks).
- After your first 30 annotations, let the agent search the remaining traces for likely instances of the failures you described. Accept or reject each suggestion yourself, and correct the agent when it misreads your criteria.
- Keep going until you reach Theoretical Saturation: new traces stop revealing new failure modes or changing existing ones. Review at least 100 traces, and keep going past 100 while you’re still learning.
- Re-review earlier traces. Your criteria will have shifted (Criteria Drift).
Bottom-up vs top-down
| Approach | What it is | Verdict |
|---|---|---|
| Top-down | Start from common metrics (“hallucination”, “toxicity”) plus a few task metrics | Convenient, but misses domain-specific issues |
| Bottom-up | Look at the data and let metrics emerge from open and axial coding | More effective. This is the recommended default |
Outputs of error analysis
- A failure taxonomy with frequencies, which becomes your prioritized backlog.
- A list of quick fixes: prompt gaps, bugs, missing features.
- Candidate evaluators for persistent failures (see When to Build an Automated Evaluator).
- Labeled traces you can reuse for Judge Validation.
- An informed rubric, written after you’ve seen the data.
Human–agent collaboration (current best practice)
From Shreya Shankar’s walkthrough and the error-discovery skill:
- The human notices; the agent organizes. You write free-text notes. The agent sorts them into a taxonomy, tracks coverage, and proposes new samples.
- The agent watches
annotations.jsonfor changes (for example with Claude Code’sMonitortool). When a new label arrives, it updates the taxonomy and looks for similar cases or for different failures. This is essentially active learning. - The agent alternates between breadth (diverse or random samples to find new modes) and depth (once a mode is found, scan the whole corpus for instances, with one subagent per mode).
- Agent suggestions are not ground truth. Favor recall: dismissing a false positive is cheap, and missing a real instance is costly.
- See Error Discovery Skill Workflow and Source - Do Automated Evals Work. Fully automated error analysis caught 74–87% of human-labeled failures but missed every failure that “looked correct” without product context.
What you shouldn’t outsource to an LLM
- Initial open coding. Always read raw traces yourself first.
- Validating the failure taxonomy.
- Ground-truth labels for judge validation.
- Root-cause analysis of subtle, workflow-specific bugs (for example, a bug that only happens when users paste from Excel).
See What LLMs Can and Can't Automate in Evals.
More lessons from the videos
- Analyze → measure → improve. AI helps least in the taste-heavy analyze step and most in measure/improve (Video - How to Automate AI Evals Correctly).
- Don’t ask an agent to “evaluate my app” in one shot. It misses anything that lives only in your head, invents a “top issue”, and nothing is reused. Persist the taxonomy and definitions (files or code) so later runs build on them.
- Loop over the data more than once (an outer loop over traces, an inner loop of hypotheses per trace). New modes appear on re-reads (e.g., an overused word you only notice after many essays).
- Let the agent apply your modes to other traces, but don’t let it add new modes. Validating an agent’s taste is worse than stating your own.
- Stare vs look: interact with your data and charts long enough for oddities to surface (Video - Build Your Own Eval Tools With Notebooks (marimo)).
- Practical tips: go slowly on the first items, note the single smoking-gun problem, use voice dictation for notes, focus on critical feedback early, and start with “just 20” to get going (Video - Intro to Error Analysis Custom Annotation Apps).
- Reading data also gives you a product roadmap: users ask for things you don’t support and assume the product works in ways you didn’t intend (Video - Error Analysis Highest ROI Technique (Nurture Boss)).
Cadence
See Eval Maintenance and Cadence. In short: re-run after significant changes (new features, prompt or model changes, incidents). Aim for 100+ fresh traces per cycle, every 2–4 weeks, and review 10–20 outlier traces weekly between cycles.
Anti-patterns
- Skipping error analysis and going straight to building eval infrastructure. This is the “tools trap.”
- Writing a rubric first. Nova Escola did this and labeled data for criteria that never appeared as failures (see Nova Escola).
- Outsourcing error analysis to generalist annotators (see Annotation Outsourcing).
- Letting an LLM do open coding.
- Predetermined query-type evaluation matrices. Let observed failure patterns define the structure (see Diverse Query Evaluation).
Related
Traces · Trace Sampling Strategies · Theoretical Saturation · Criteria Drift · Benevolent Dictator · Annotation Tools and Review Interfaces · Eval Playbook