

Obsidian Metadata
Annotation Tools and Review Interfaces
"Build a custom annotation tool."
Hamel calls it the single most impactful investment for an AI eval workflow. Teams with custom annotation tools or data viewers iterate ~10× faster. With AI coding assistants (Claude Code, Codex, Cursor, Lovable) you can build one in hours.
Remove ALL friction from looking at data. Hunting through several systems to understand one interaction doesn’t just slow you down. It discourages the systematic analysis that catches subtle issues.
Why custom beats off-the-shelf
- Shows all context from multiple systems in one place (trace log, CRM record, calendar, source docs).
- Renders data in a product-specific way (emails as emails, widgets, markdown, images).
- Fits your workflow: custom filters, sorting, progress bars.
Off-the-shelf tools are justified mainly when coordinating dozens of distributed annotators with enterprise access controls, and even then the configuration overhead often isn’t worth it. Example: Isaac Flath’s Anki flashcard annotation app handles 400+ results per query with keyboard navigation and domain-specific criteria that would be nearly impossible to configure in a generic tool.
Minimum viable version: a Jupyter notebook (arbitrary code, visualization, fast iteration), or even a spreadsheet. “A spreadsheet is better than nothing.”
Features that work (pick what you need; keep it minimal)
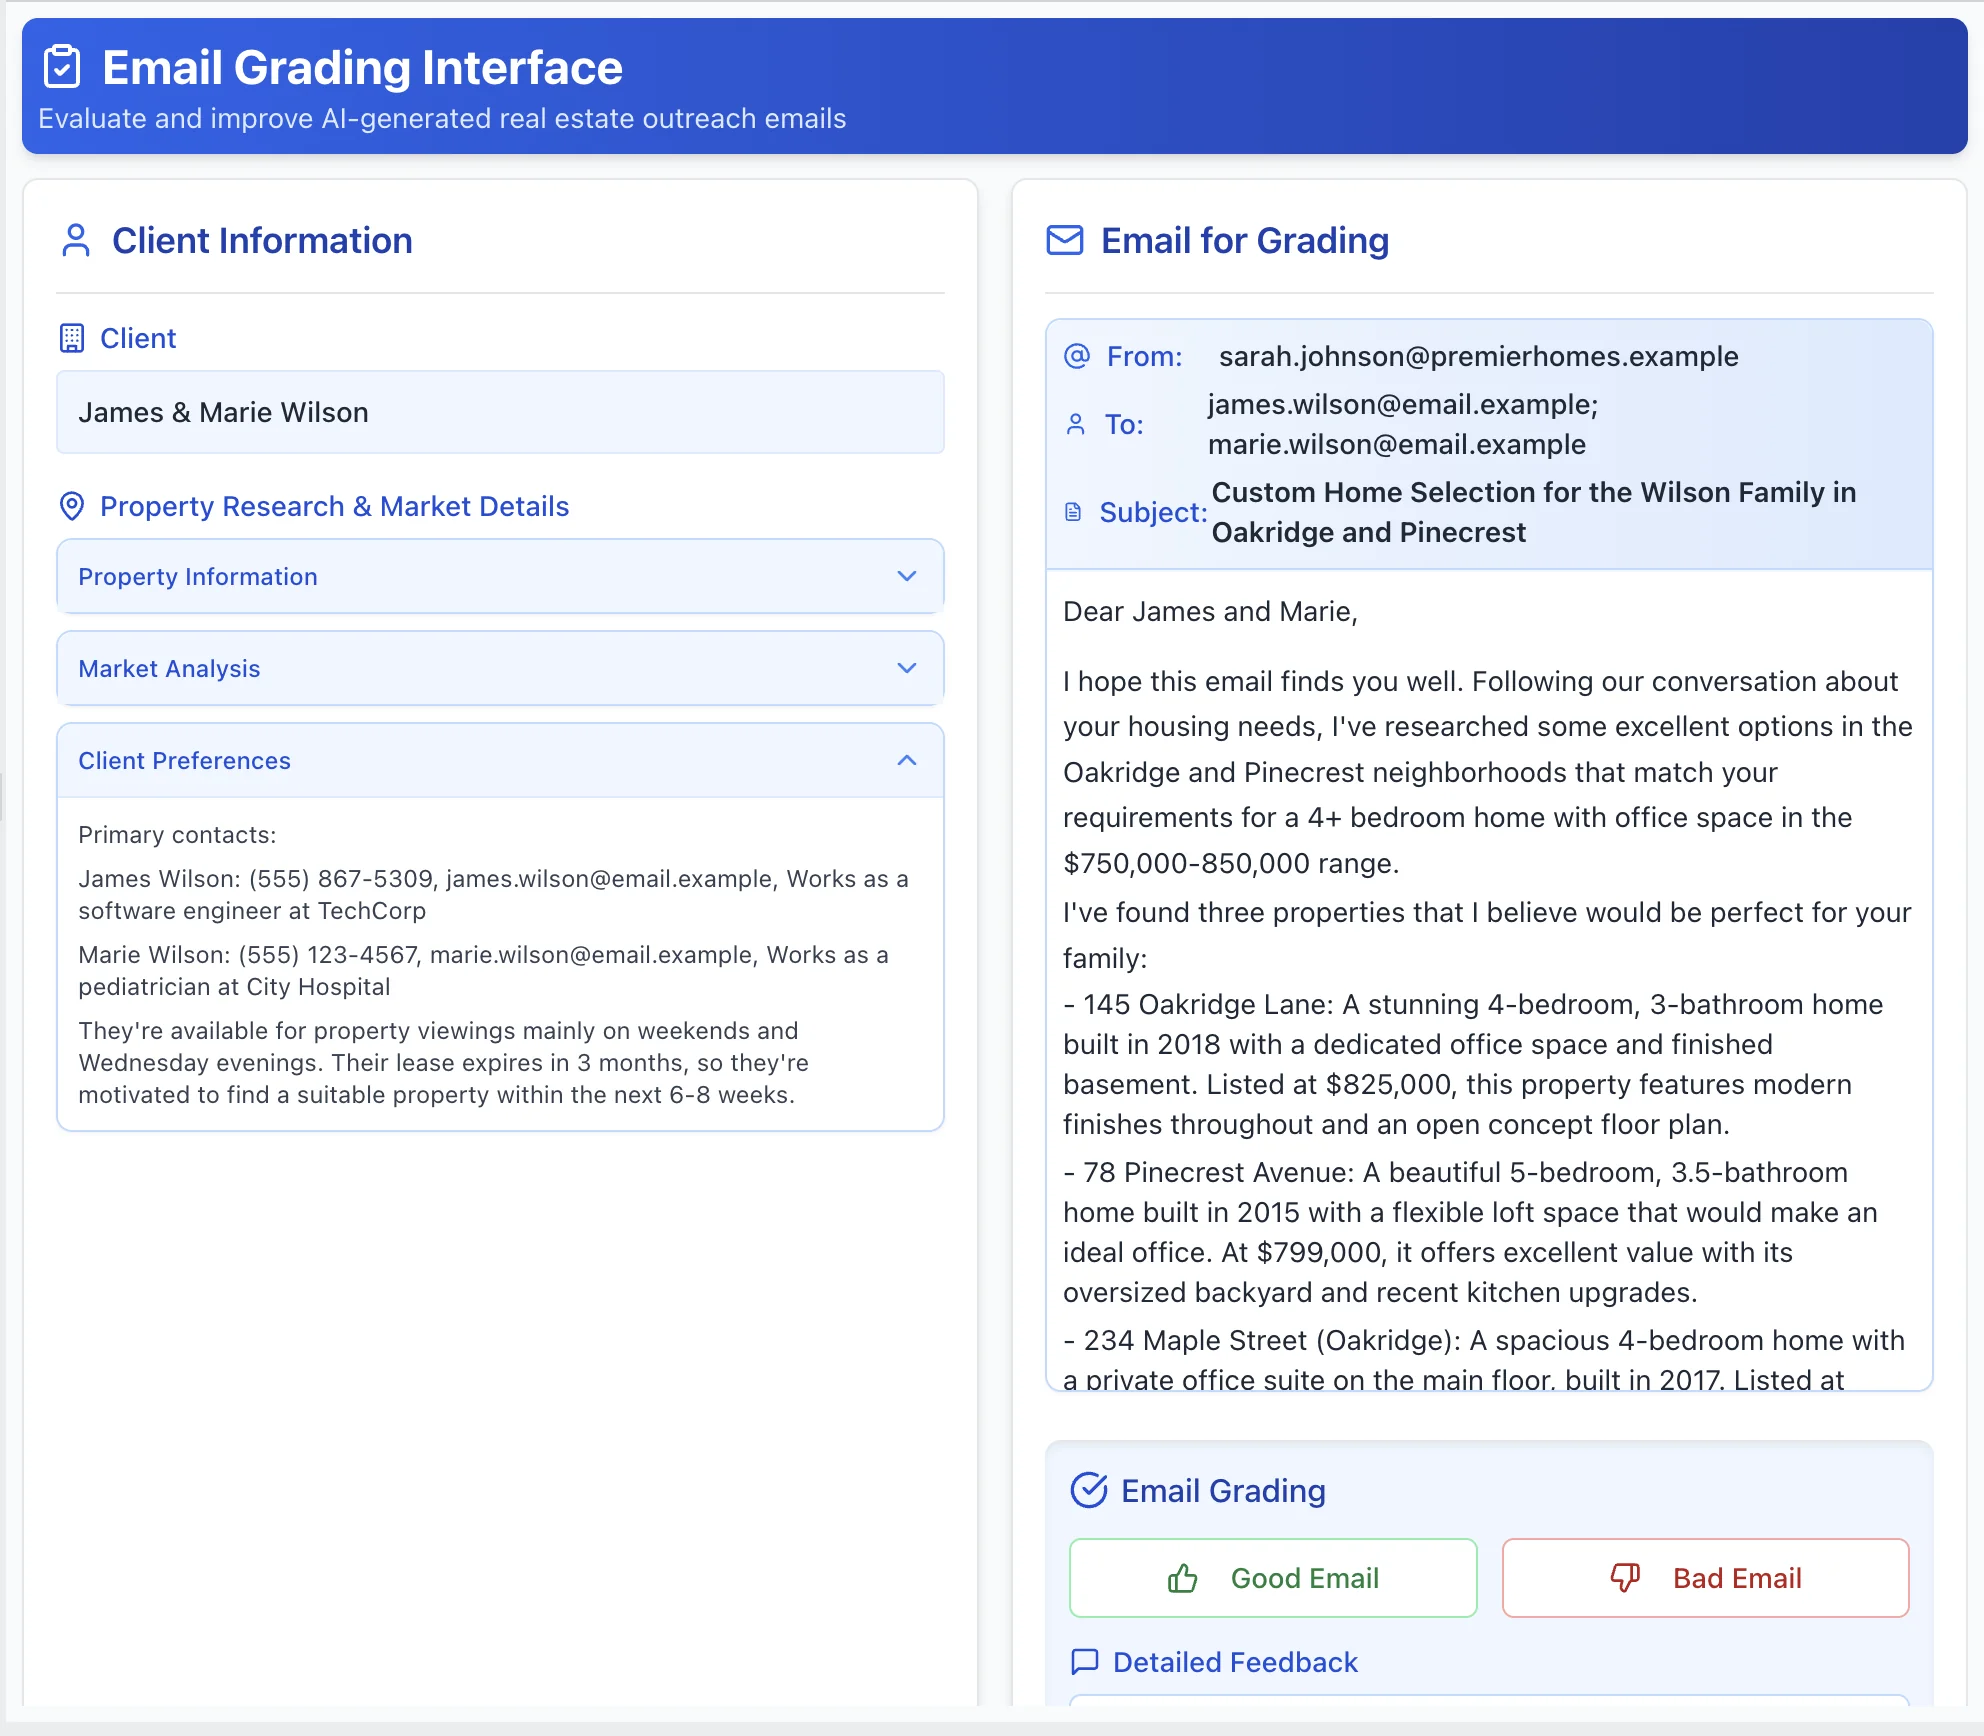
1. Render traces intelligently, not generically
- Emails look like emails, code gets syntax highlighting, markdown is rendered, tables are tables, JSON is pretty-printed and collapsible.
- Show the full trace (input, tool calls, retrieved context, reasoning) but collapse less important details (progressive disclosure). Never make reviewers read raw JSON.
- Collapse repeated elements (an identical system prompt in
<details>). - Surface key metadata as headers or badges (property, client type, channel, pipeline version, synthetic vs real).
- Color-code by role (user / assistant / tool / system). Visually group a tool call with its result.
- Show the outcome: the confirmation, generated email, or DB update that proves the goal was met. This lets non-technical experts judge results, not implementation.
- Sanitize: strip raw HTML from LLM outputs and disable remote images (tracking pixels).
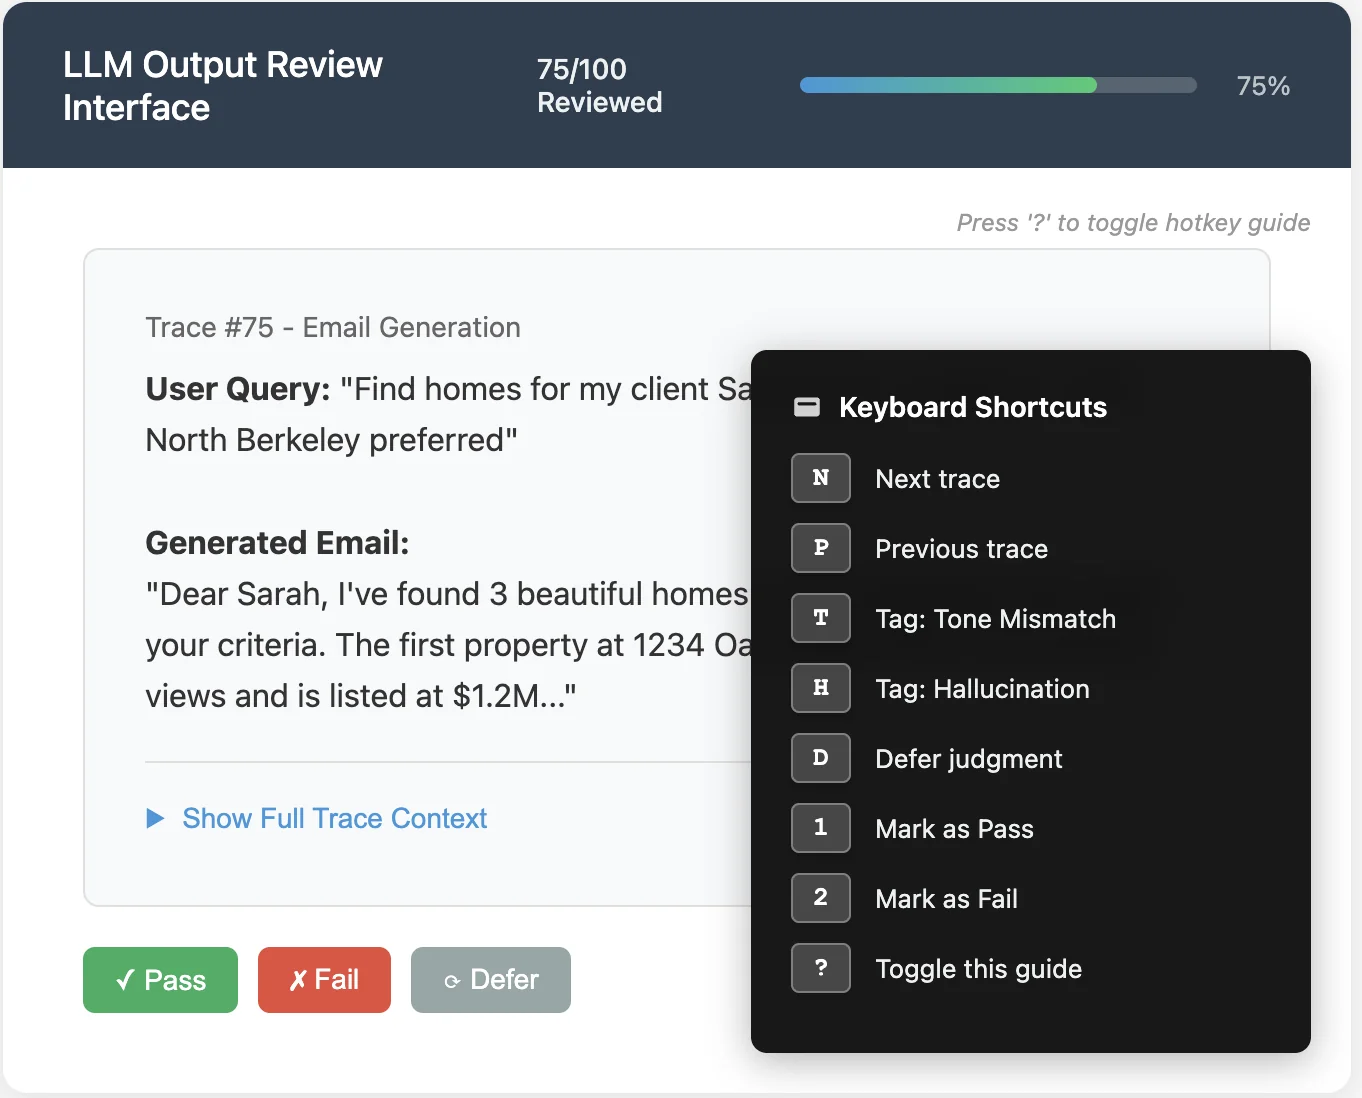
2. Show progress and support keyboard navigation
- “Trace 45 of 100”, which keeps sessions bounded and motivating.
- Hotkeys:
←/→navigate,1Pass,2Fail,DDefer,UUndo,Cmd+Entersave and next,Nnext. - Notes saved without reaching for the mouse. Auto-save on every action.
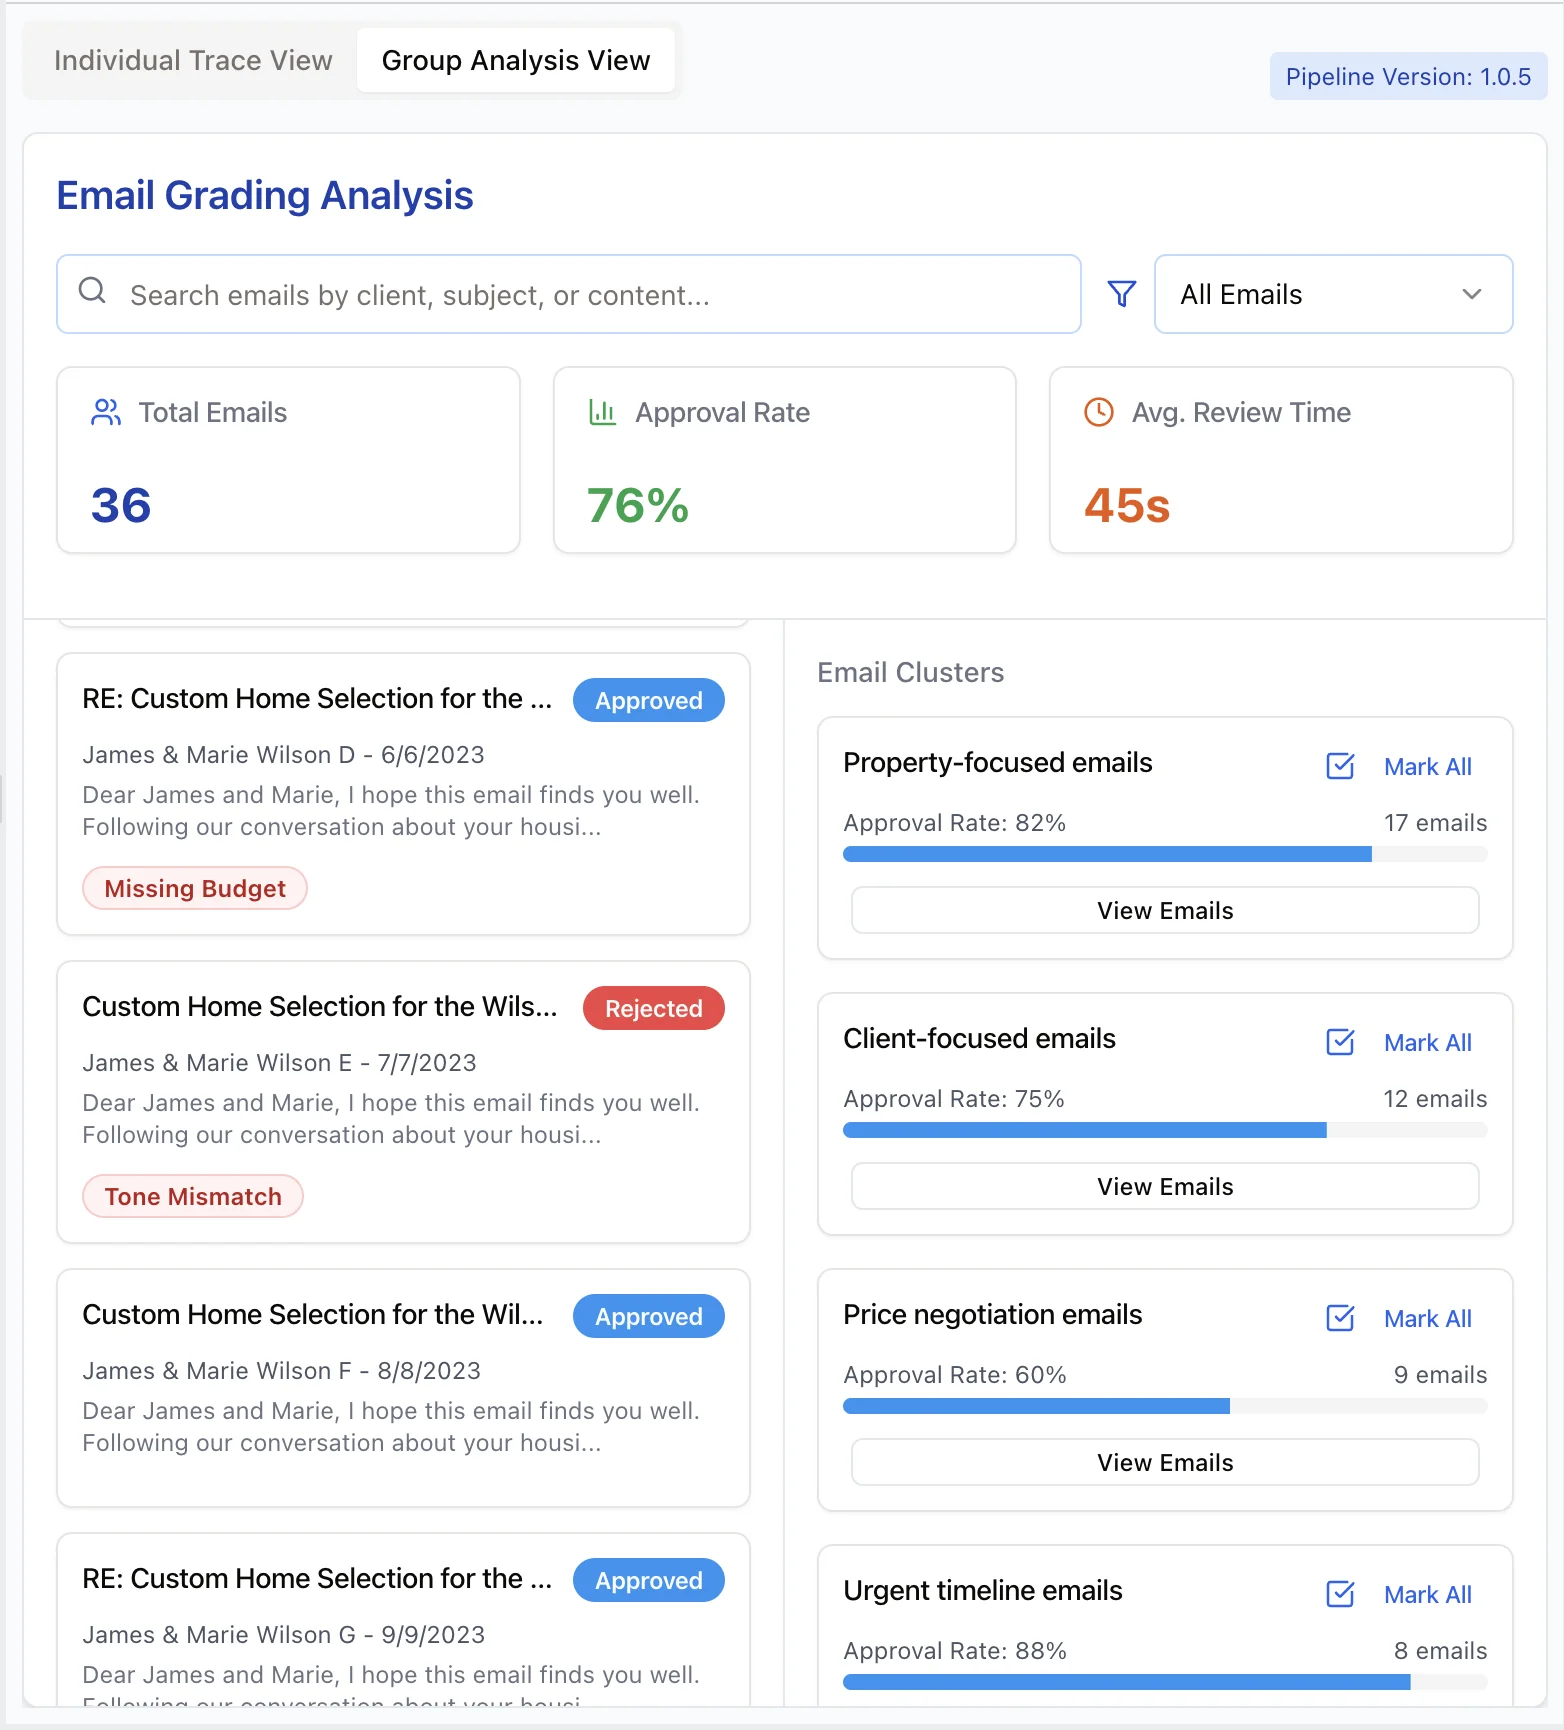
3. Navigation through clustering, filtering and search
Filter by metadata (channel, persona, property), keyword and semantic search, and cluster views (e.g., by persona) to spot recurring issues.
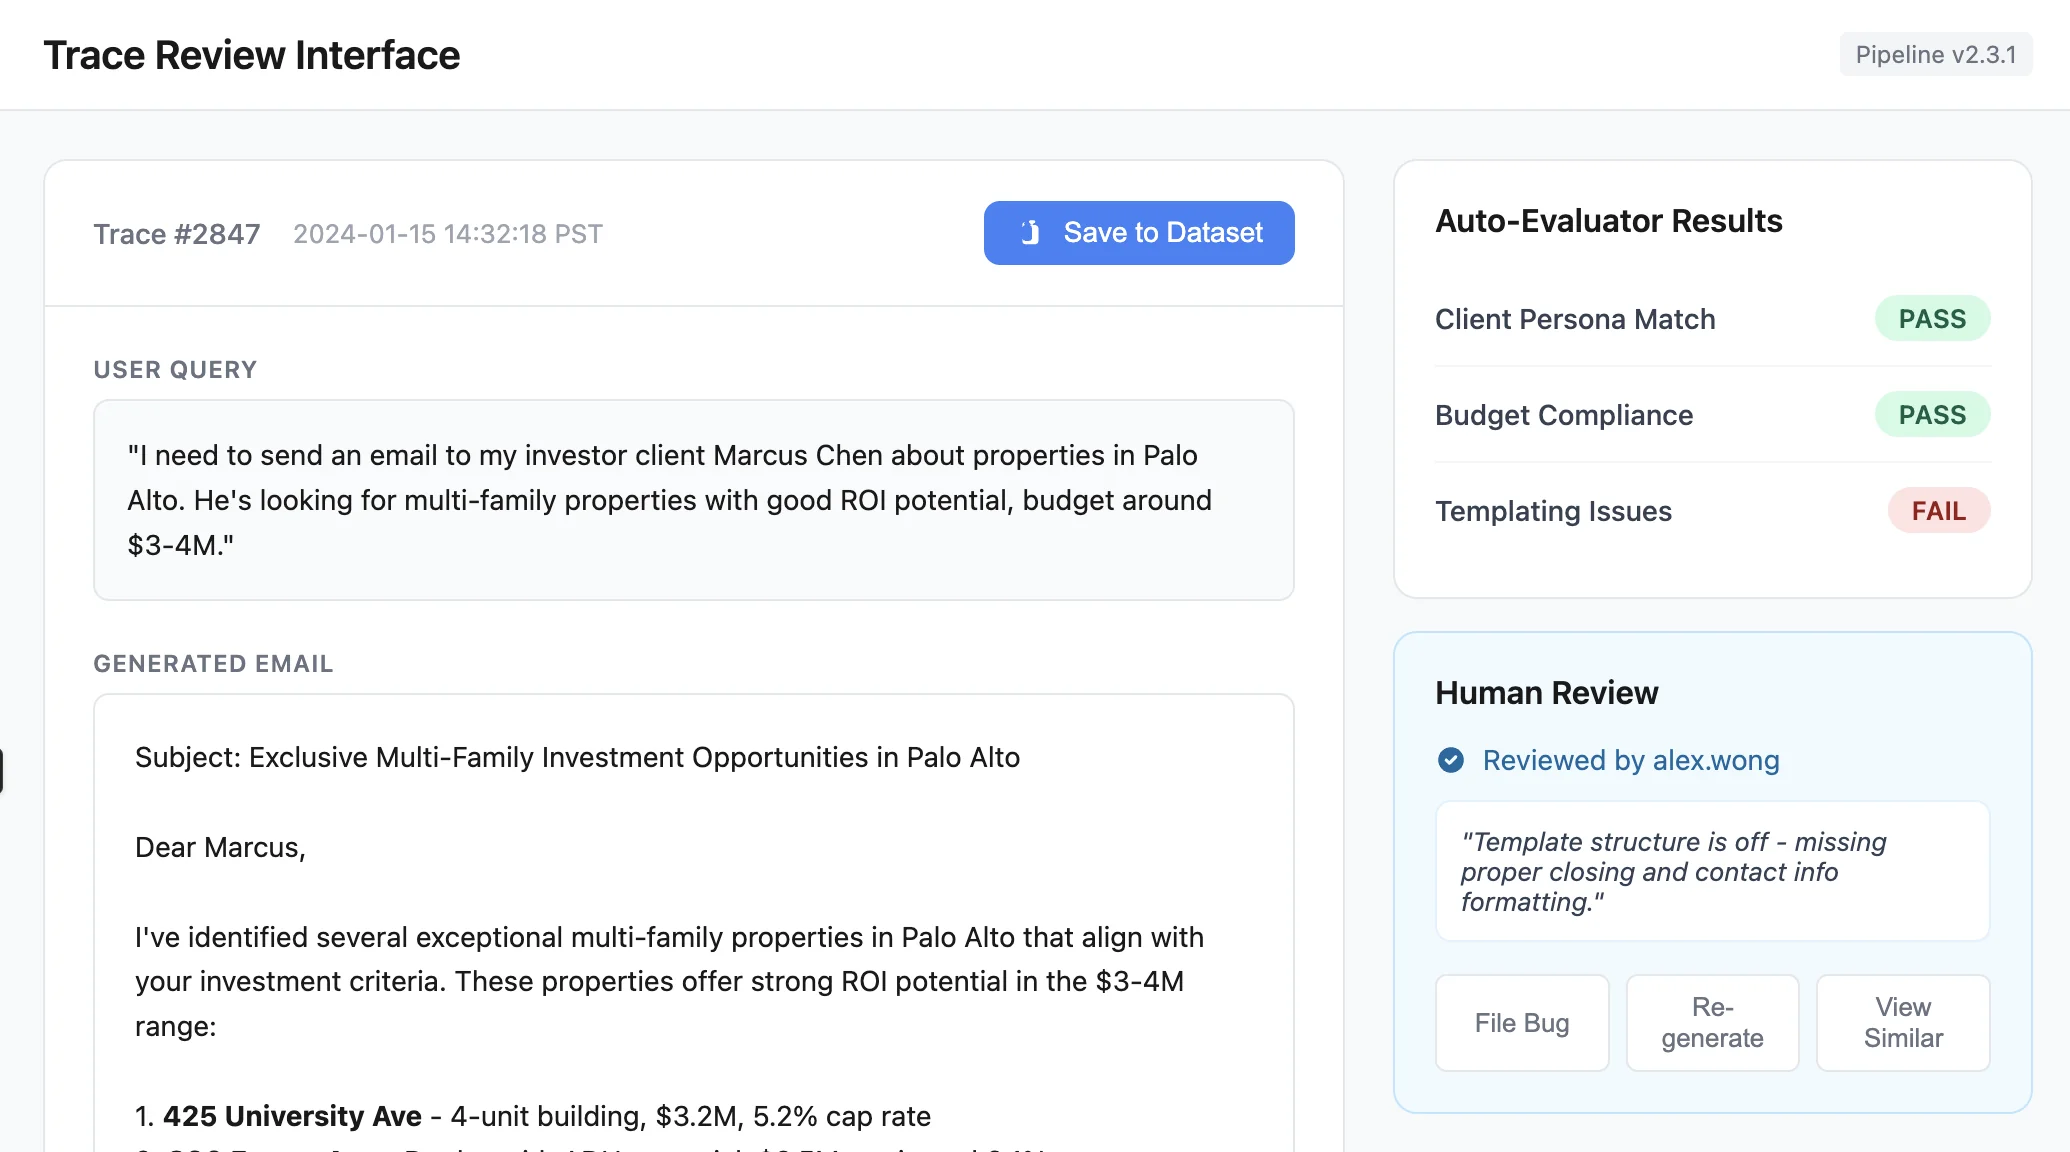
4. Prioritize likely-problematic traces
Surface traces flagged by guardrails, CI failures, or automated evaluators. Add action buttons: add to dataset, file bug, re-run pipeline test. Show context inline (pipeline version, eval verdicts, reviewer).
Feedback capture
- Binary Pass/Fail as the primary action, plus a free-text notes field, plus Defer for uncertain cases.
- Free text first. Don’t pre-define failure-mode dropdowns in the first build. Add clickable failure-mode tags only after error analysis has settled a taxonomy.
- Annotate at the trace level by default (the
error-discoveryskill also supports inline span highlights with margin notes). - Rechat made the final output editable so reviewers could fix small mistakes and curate fine-tuning data.
- Optional reference panel (ground truth, rubric definitions).
Patterns from the video demos
- Two annotators + a finalize step: only disagreements go to a second pass, where each annotator sees the other’s rating and records a final rating with a reason. Useful while the rubric is still forming (Video - Building Eval Tools with FastHTML (AnkiHub)).
- Rate the input too: AnkiHub’s reviewers also judged whether the query was reasonable (too broad), a need found only after labeling began.
- Notebook-native labeling: reactive notebooks (marimo) + anywidget, lasso-select a cluster on a UMAP plot, then label with yes/no/skip, hotkeys, a gamepad, and speech-to-text notes (Video - Build Your Own Eval Tools With Notebooks (marimo)).
- Build with coding agents: have the agent write a markdown plan you edit first, keep shared framework context files, and give it a small Playwright MCP so it can click through the app and read browser console errors (Video - Building Custom Eval Tools With Coding Agents).
- One UI per annotation shape (whole trace vs single question) is fine when they’re cheap to vibe-code. You can even label in the terminal by having the agent show one item at a time (Teresa Torres Interview Coach).
- Fitts’s law: big, nearby buttons speed up labeling. Consider a “Tinder-style” SME view that hides the internals.
Design checklist (build-review-interface skill)
- Same layout, controls, and terminology on every trace
- Pass/Fail visually distinct
- Keyboard shortcuts for all primary actions
- Full trace accessible even when sections are collapsed
- Labels persist automatically
- Trace-level annotation by default
- All data in native format
- Tested (e.g., Playwright: label, navigate, reload, verify persistence)
Stack suggestions
Anything you know. Hamel uses FastHTML + MonsterUI (backend and frontend in one small Python file). Gradio, Streamlit, Panel, and Shiny all work, and Rechat’s tool was built with Shiny for Python in under a day. The error-discovery skill builds a single-file HTML app served by Python’s stdlib http.server with content, map (PCA/UMAP scatter), and progress (failure-mode treemap) views.
Related
Designing for Verification · Error Analysis · Reviewing Large Traces · Error Discovery Skill Workflow · Eval Tooling and Vendors